Right, you've got your server up and running and it is being backed up regularly. Your next job as an amatuer server administrator is to put in place some monitoring and logging capabilities so you can be notified in case it stops working.
Resource monitoring
The good news if you are using Amazon Lightsail is that all the monitoring you will (probably) ever need is built in. Tech fiddlers may still be interested to learn about the more elaborate AWS CloudWatch service (see below).
The standard Lightsail offering automatically collects various performance metrics for instances, load balancers and databases:

The metrics captured for instances include information on CPU and network utilisation and system health information. You can also set thresholds and alarms to alert you to potential issues with the performance of your server:
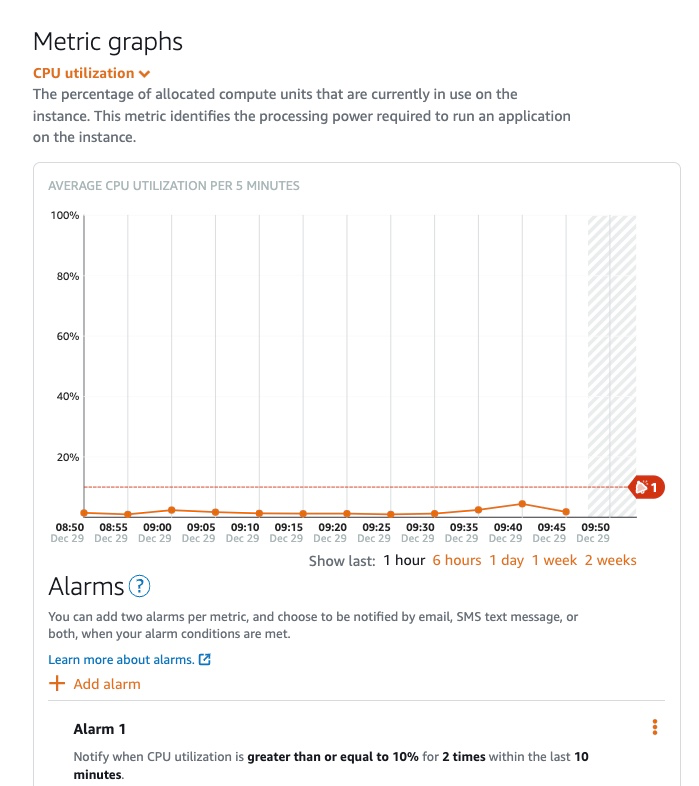
Hopefully this is all pretty self-explanatory, but one of the metrics deserves a bit of explanation:
CPU burst capacity
Amazon Lightsail instances are 'burstable' - this means they provide a baseline level of CPU performance with the ability to "burst" above the baseline.
The performance baseline is determined by the instance size. For example, at the time of writing the 1GB/1CPU instance type this server runs on has a baseline of 10% CPU utilization. When cpu utilization is above the baseline the server is said to be running in the burstable zone.
Since Amazon can allow other customers to use any "spare" CPU cycles freed up when your servers are not in the burstable zone they can make better use of their hardware and therefore reduce the cost of the service to the end user.
Burstable instances are therefore cheaper than paying for a fixed amount of CPU capacity sufficient to handle your server at its busiest times and are therefore a good solution if your application typically runs below the baseline but needs better performance now and then.
To make this arrangement work the amount of available burst capacity is limited and, although it is replenished throughout the day, if you exhaust the burst capacity Amazon will throttle the server back to the baseline performance. This is is how Amazon explain the calculation:
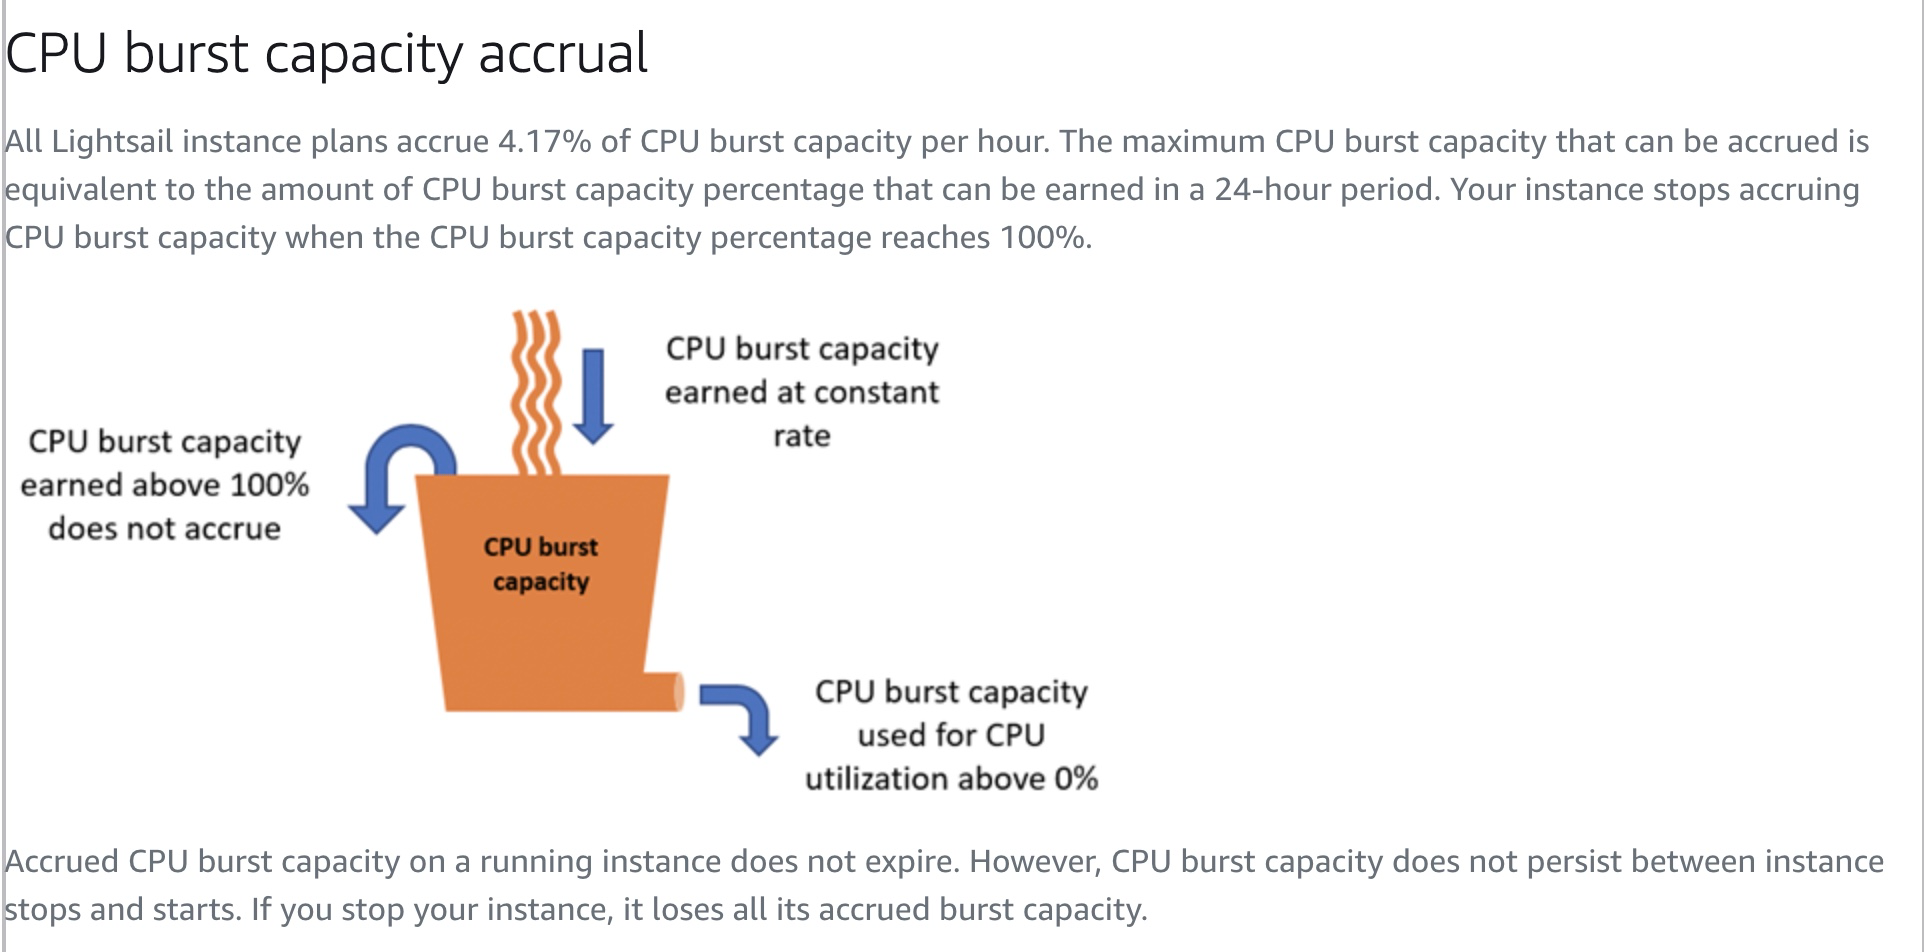
If your server is spending a lot of time running in the burstable zone you should monitor this metric to make sure you do not reach the point where burst capacity is exhausted. If this happens, and the the cpu usage is throttled while the server is still busy, the server can become unresponsive. The article from Amazon explains how to set up a custom alarm to be notified when your burst capacity is running low:

CloudWatch
In case you have advanced monitoring requirements, say you would like to collect more granular metrics (Lightsail is hard wired to collect stats every 5 minutes) or you need to report on metrics not currently available in Lightsail (e.g memory or disk utilisation) then you can use the AWS monitoring service, Amazon CloudWatch.
CloudWatch automatically manages a variety of metrics for standard EC2 instances, however, the metrics collected in Lightsail are not visible in the CloudWatch dashboard for your account. We can work round this by using the CloudWatch feature that was designed to capture metrics for on-premise servers. This involves three steps:
- creating an IAM user with the necessary permissions to submit the CloudWatch metrics data collected on the virtual server
- installing the CloudWatch Agent on the virtual server
- Configuring the CloudWatch Agent to use the IAM user when submitting data to CloudWatch
CloudWatch IAM user
You need to create an IAM user with the permissions needed for the CloudWatch agent to write metrics to CloudWatch.
The instructions are below. You can skip the part which describes how to create an IAM role (this only applies if you are installing the agent on EC2 instances) and, unless you plan to use the Systems Manager Parameter Store to enable multiple servers to use a single CloudWatch agent configuration, then you can also skip that section:

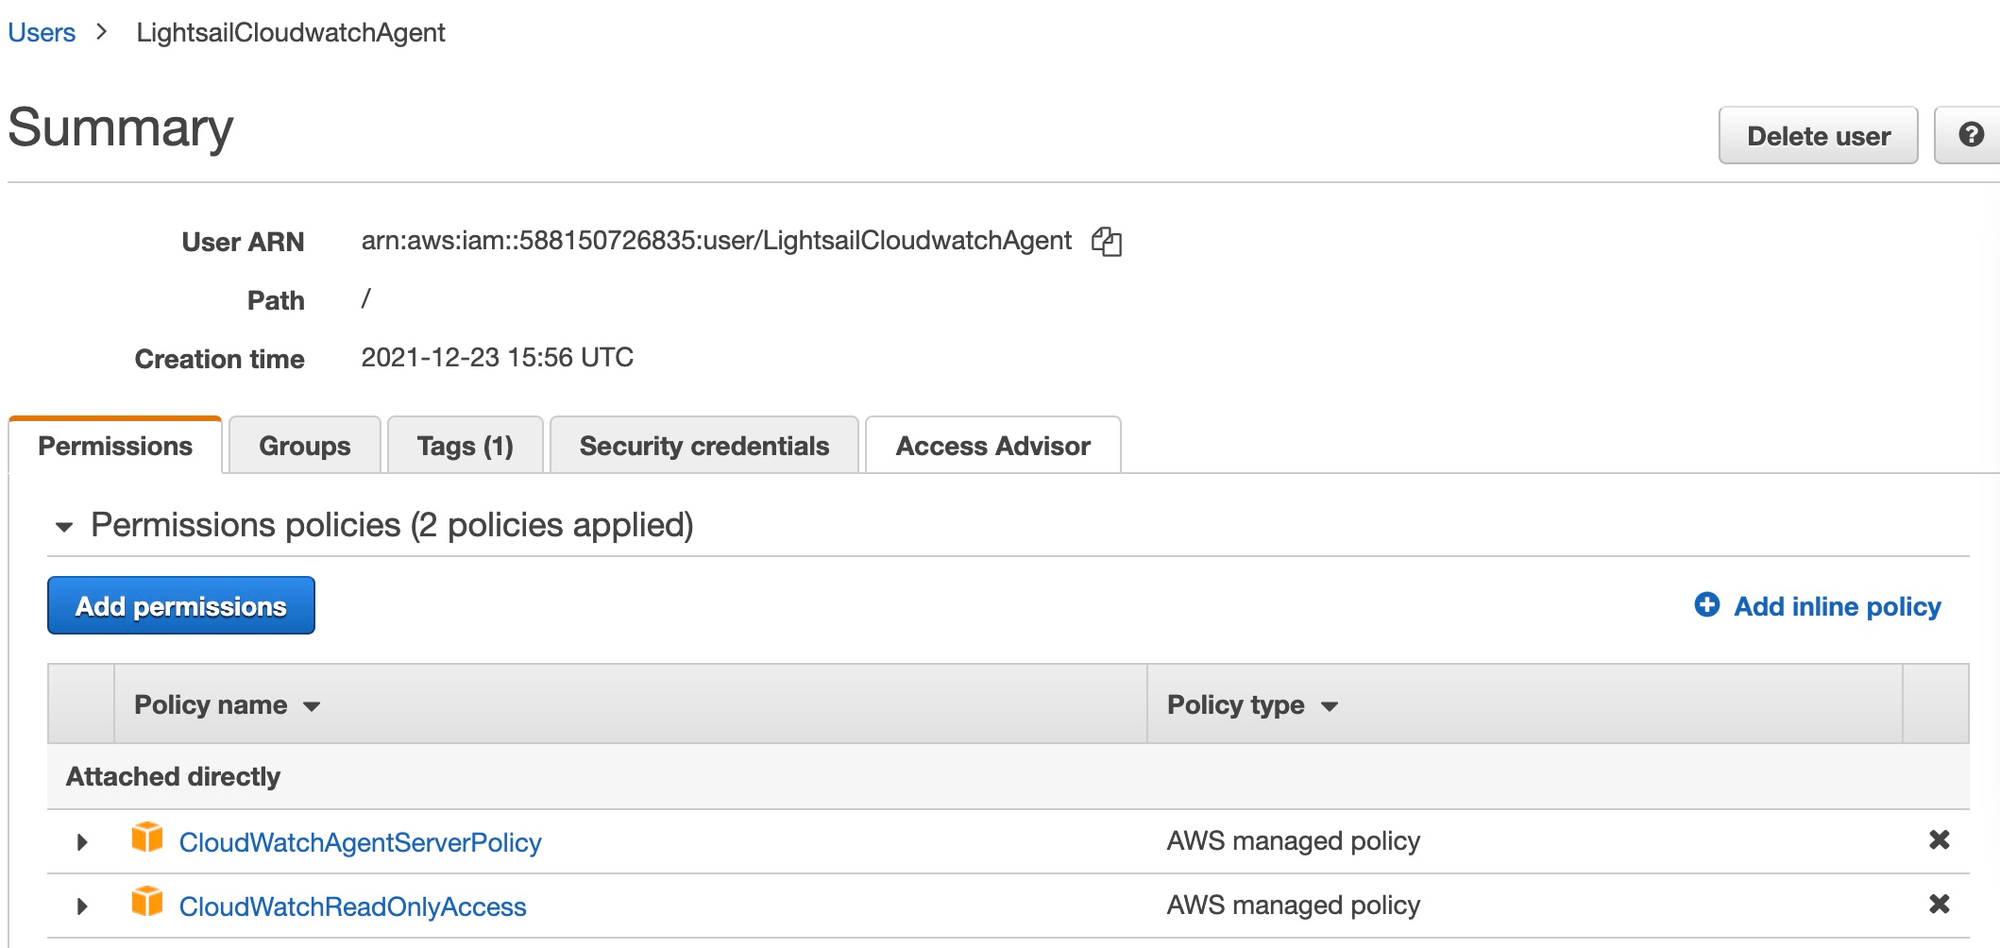
I named the user on my account LightsailCloudwatchAgent and in addition to the required CloudWatchAgentServerPolicy I also added CloudWatchReadOnlyAccess so the user can read the cloudwatch data (see below).
CloudWatch agent
After you create your IAM user you need to install the CloudWatch agent on your virtual machine .
The latest agent for your OS can be installed following these instructions:
Agent metrics configuration
Before running the CloudWatch agent you must create a CloudWatch agent configuration file.
The agent configuration file is a JSON file that specifies the metrics that the agent is to collect. You can create it by using the configuration wizard. On an Ubuntu server the wizard is located here /opt/aws/amazon-cloudwatch-agent/bin/amazon-cloudwatch-agent-config-wizard
... and this will set some sensible defaults based on your answers to the questions.
By default the resulting json file is created as /opt/aws/amazon-cloudwatch-agent/bin/config.json
Don't forget to choose "on Premises" when answering the "Are you using EC2 or On-Premises hosts?" question
There is an option to retrieve custom metrics from services using the StatsD and collectd protocols. You should say 'no' to the prompt to enable these services unless you are running applications that use them.
More information on the configuration file is below, should you wish to manually edit the file:

Agent credentials
Now that you have installed the CloudWatch Agent, you need to tell it what credentials to use to submit data to the CloudWatch service. The first step is to create credentials profile on your server:
sudo aws configure --profile AmazonCloudWatchAgent
You will need to supply the access key and secret key generated when you created the IAM user above. The credentials will be added to the /root/.aws/credentials file.
When running on a standard EC2 instance, the default behaviour is for the CloudWatch Agent to connect to the CloudWatch service using a CloudWatch agent role that has been associated with the instance.
When running in "on premise" mode the agent will connect using a separate profile and - according to the documentation - AmazonCloudWatchAgent is the default profile name and the agent should use it automatically unless instructed to use a different account on start-up.
In practice even when you create a profile called AmazonCloudWatchAgent and start the agent with the -m onPremise parameter, the agent does not use the profile and instead tries to use the AmazonLightsailInstanceRole to insert the data (this does not work because the role does not have the necessary permissions).
The log file contains the message I! Detected the instance is EC2 , so I suppose the agent is trying to apply the default EC2 credential strategy to the Lighthouse instances - which are really rebadged EC2 instances - regardless of the mode specified on the command line.
We can work around this problem by editing/opt/aws/amazon-cloudwatch-agent/etc/common-config.toml and adding the following lines:
[credentials]
shared_credential_profile = "AmazonCloudWatchAgent"
The original purpose of the shared_credential_profile line appears to be to let you specify a different IAM user credential profile to the default but, luckily for us, it also overrides the EC2 credential strategy and makes the agent use the AmazonCloudWatchAgent profile rather than the assumed instance role.
Start the agent
The following command is used to start the CloudWatch agent:
sudo amazon-cloudwatch-agent-ctl -c file:/opt/aws/amazon-cloudwatch-agent/bin/config.json -a fetch-config -sthe -a fetch-config parameter tells the agent to apply the configuration specified in the -c parameter . The -s instructs the agent to restart after the configuration has been processed.
-a status can be used to ensure that the agent is running:
sudo /opt/aws/amazon-cloudwatch-agent/bin/amazon-cloudwatch-agent-ctl -a statusCreate dashboards and alerts
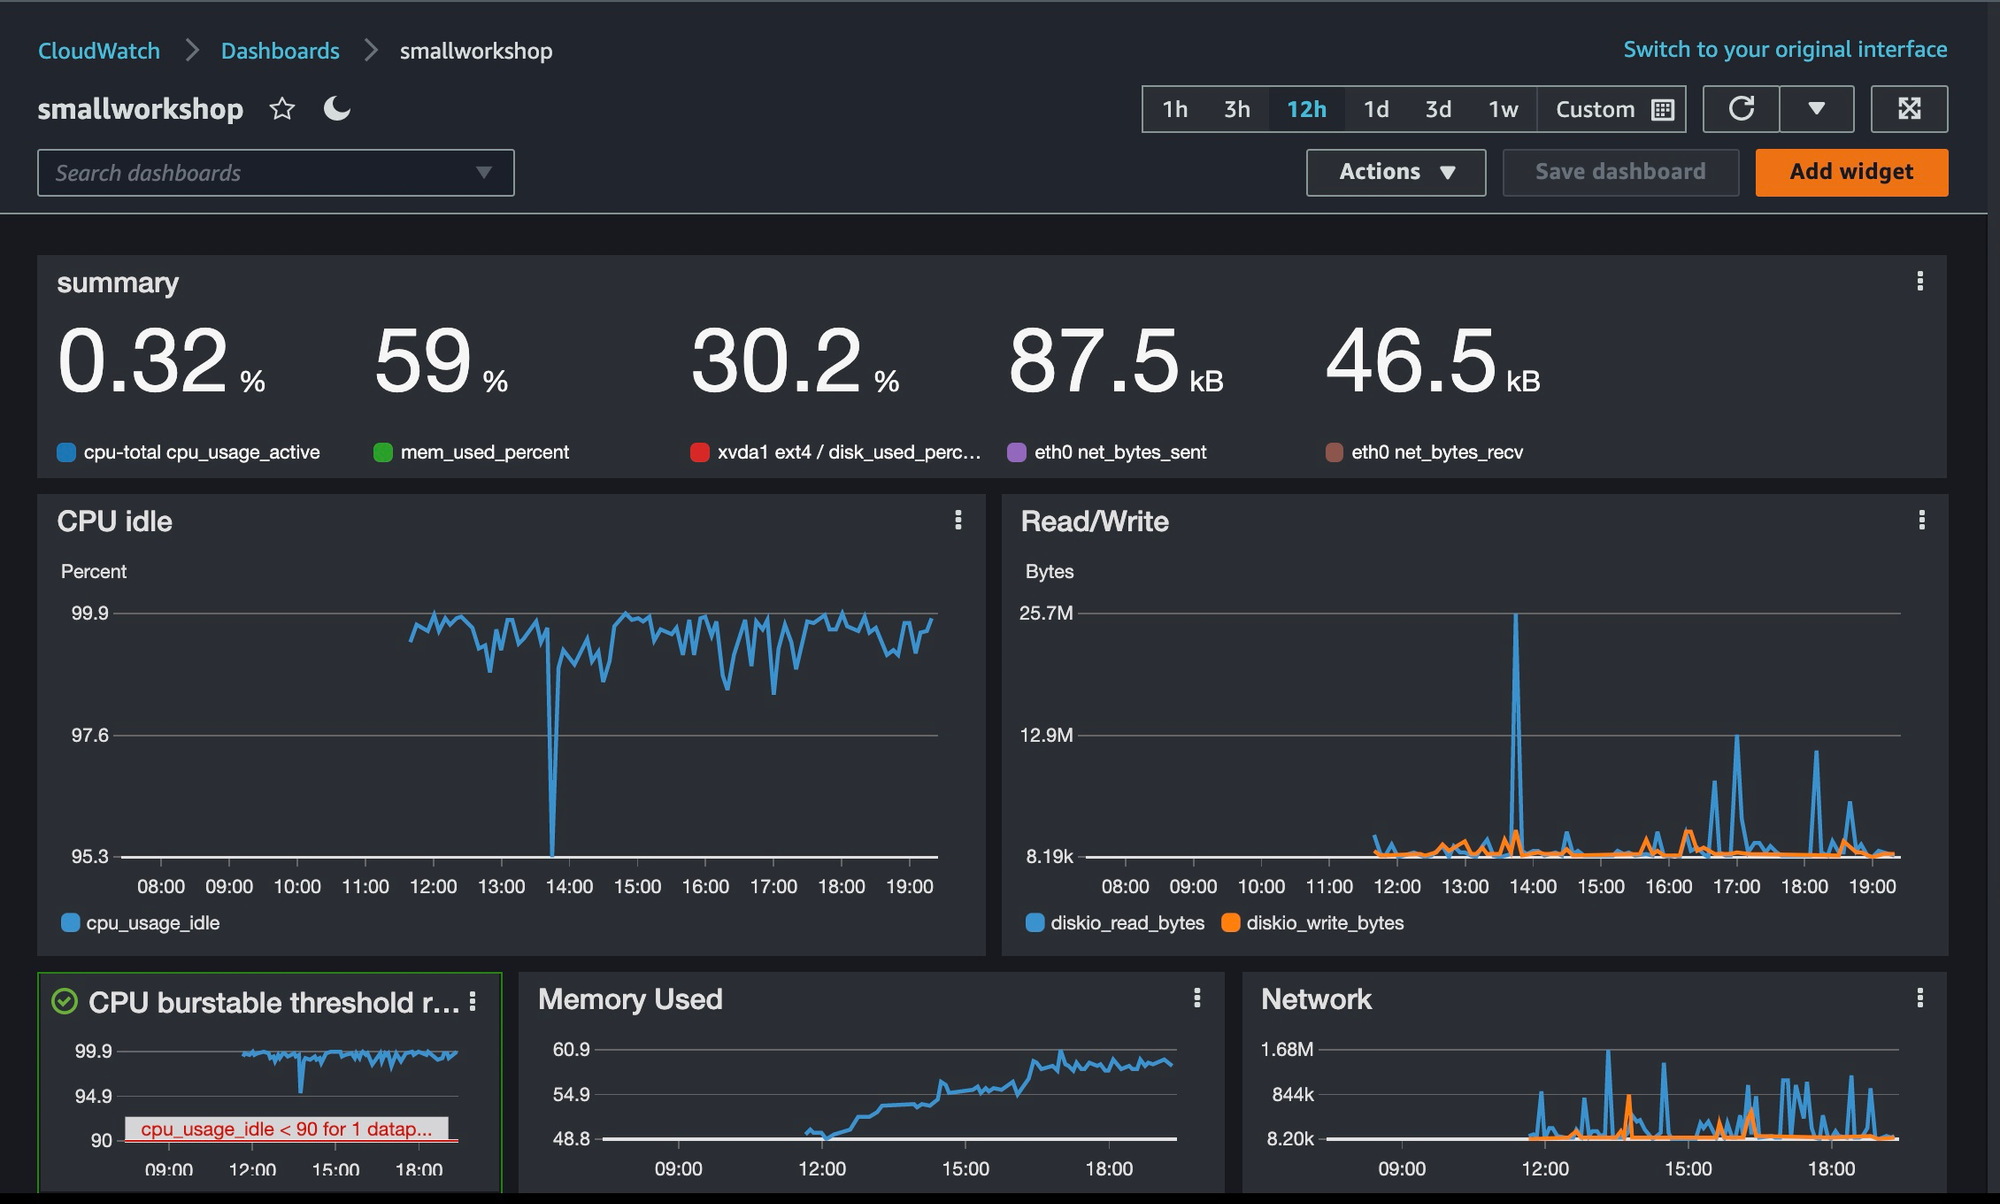
You can now navigate to the CloudWatch console and view the Metrics section where you should see a section called CWAgent under Custom Namespaces.
The interface is very straightforward and within a few minutes you can knock up a dashboard for your site. Here's mine:
Log file collection
CloudWatch comes with facilities to centralise logs and make them visible in the console:
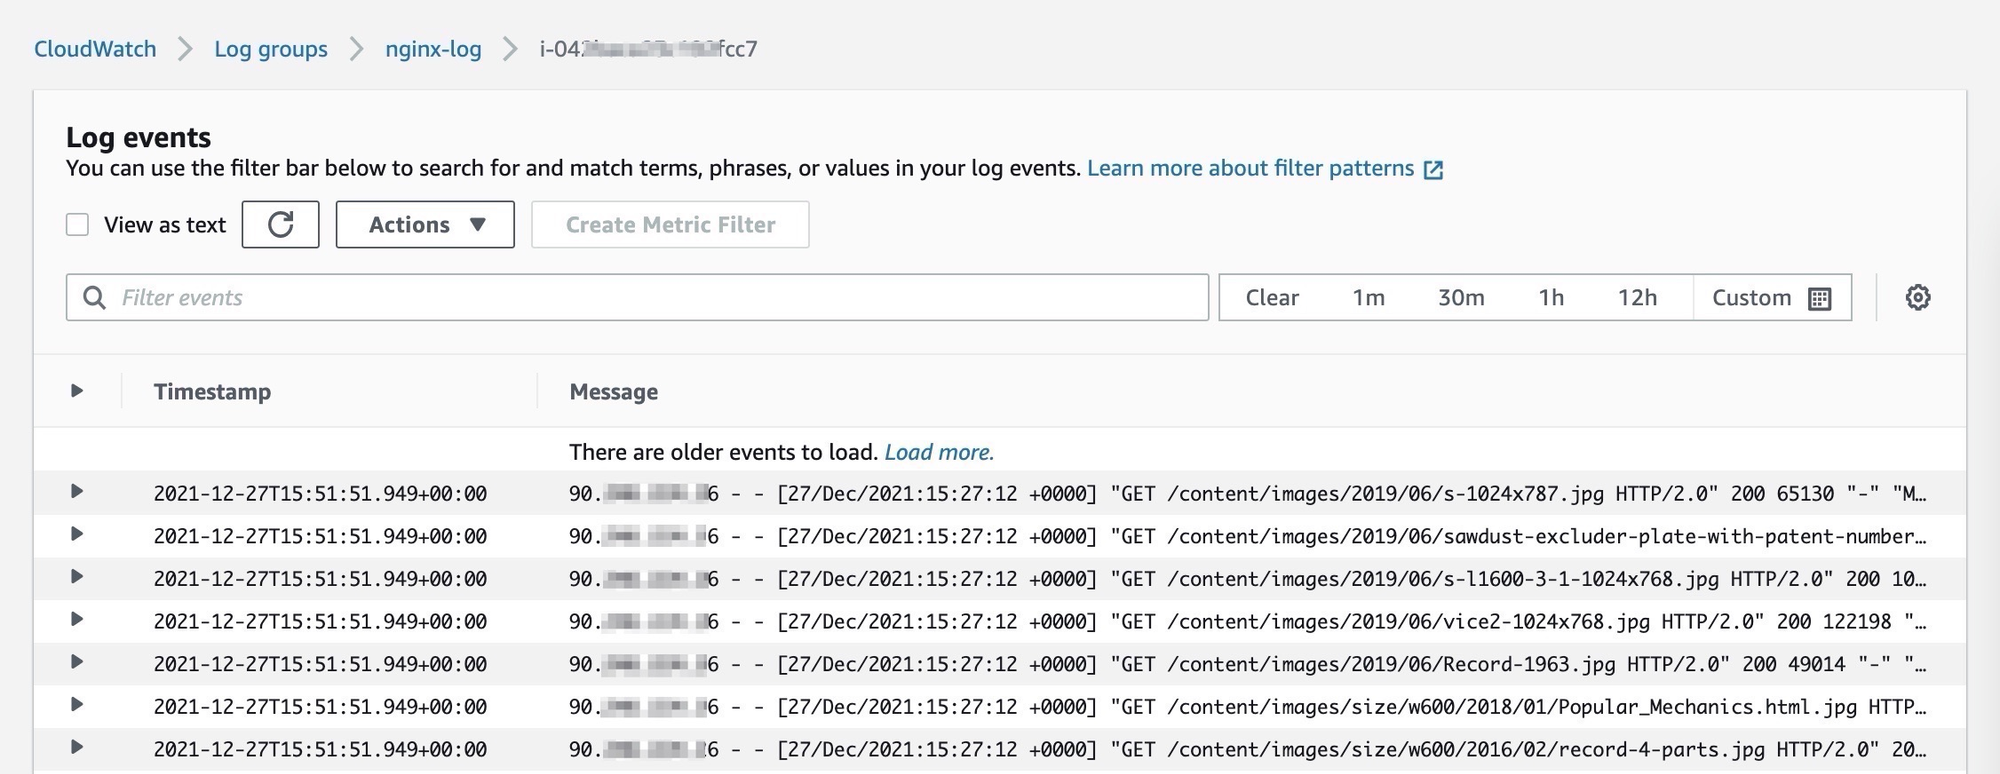
You can configure the log agent by editing the Agent configuration file/opt/aws/amazon-cloudwatch-agent/bin/config.json. Here is an example of how you can configure the agent to collect nginx logs:
 "logs": {
                "logs_collected": {
                    "files": {
                        "collect_list": [
                            {
                                "file_path": "/var/log/ngixnx/access.log",
                                "log_group_name": "nginx-log",
                                "log_stream_name": "{instance_id}"
                            },
                            {
                                "file_path": "/var/log/ngixnx/error.log",
                                "log_group_name": "nginx-log",
                                "log_stream_name": "{instance_id}"
                            }
                        ]
                    }
                }
        },
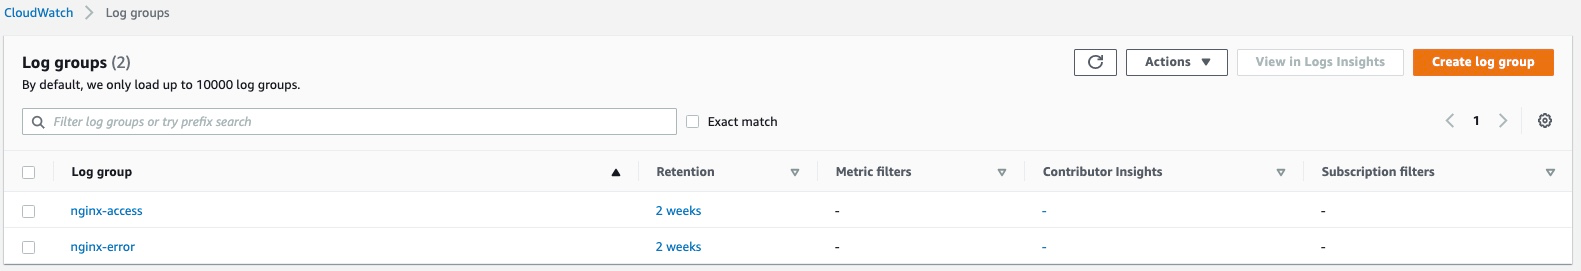
Note there are charges for log file storage that exceed the free tier limit (currently 5GB) and the default setting is to retain log files indefinitely, so you will probably want to update the retention settings:
If you added the CloudWatchReadOnlyAccess profile to your IAM CloudWatch user you can use the aws command line interface to query cloudwatch data, for instance:
aws --profile AmazonCloudWatchAgent cloudwatch list-metricswill list all of the metrics that your instance is sending to CloudWatch.
Limitations
free tier
There is a fairly liberal free-tier for CloudWatch, but you should check the details compared to your own usage.
Note there are no charges for the standard lighthouse metrics, although you are limited to the number of alerts you can set up.
System and Instance check metrics
System status checks can tell you about issues with the underlying host server operated by Amazon and the Instance checks will tell you about whether your instance can respond to basic network requests. Unfortunately, although these same metrics are collected for Lightsail instances, the data are not visible in CloudWatch. If you want to get email/SMS alerts in case of this type of failure, you will need to use the native Lightsail alerting feature.